In finance and statistics, the coefficient of determination, also referred to as R-squared (or R2) is a measure of the relationship between two data sets used in a mathematical model.
Image Credit:
ijeab/iStock/GettyImages
In finance and statistics, the coefficient of determination, also referred to as R-squared (or R2) is a measure of the relationship between two data sets used in a mathematical model. It represents the ratio of variance in the dependent variable that can be predicted from the independent variable in the model. It’s often used in regression analyses to evaluate predictions of future outcomes based on observed outcomes. You can calculate R-squared in Excel using the RSQ function.
Coefficient
of Determination in Excel
In Microsoft Excel, the RSQ function is used to determine the R-squared value for two sets of data points. The function returns the square of the Pearson product moment correlation coefficient, which measures the linear correlation between variables x and y. The correlation coefficient always falls within the range of -1 and +1. The value returned by RSQ in Excel is always between 0 and 1 (since it’s calculated as the square of a correlation coefficient, it can never return a negative value).
RSQ Function Syntax
The RSQ function takes two data sets as arguments, referred to as known_x and known_y. These data sets can be in the form of a list of numbers or a list or range of cell references. For example, say you wanted to do a regression analysis on money spent for advertising vs. income from sales, where monthly ad expenditures are listed in column A and monthly income is listed in column B. You can use the RSQ function by inputting RSQ(A1:A10,B1:B10), which uses values in rows 1 through 10 from columns A (ad costs) and B (income).
Using the CORREL and PEARSON Functions
Excel also provides a way to calculate the correlation coefficient for two data sets using the CORREL and PEARSON functions. Like the RSQ function, both CORREL and PEARSON takes two ranges of cell values as arguments. Taking the result of CORREL or PEARSON to find the correlation coefficient and squaring the result is the same as using the RSQ function to determine the coefficient of determination.
Interpreting RSQ Results

The CORREL and PEARSON functions return values between -1 and 1. This is a dimensionless measure of positive or negative correlation between the two sets of data provided as arguments. The return value from the RSQ function is between 0 and 1, sometimes expressed as a percentage from 0 to 100. Many analysts believe that a higher RSQ result indicates a more accurate mathematical model, while others say it’s important to look at all the factors that could skew a high or low result before drawing conclusions.
Experts also say you should avoid comparing R-squared values for different models and sets of data. In cases where they are wide differences between the type of data being compared, results can be misleading. There are more complicated measures for comparing models than R-squared values, such as F-Tests and information criteria.
Visualizing Regression Analysis
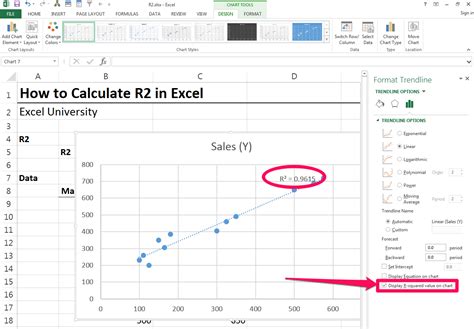
The Excel scatter chart is most often used to show relationships between sets of data during regression analyses. The range of values for one set of data is shown on the horizontal x-axis and the range for the other set on the vertical y-axis. Data points are mapped to the intersection of x and y values by using pairs of values from each data set.
Using the advertising and sales example, where ad costs are listed in column A and monthly income in column B, the horizontal axis would show the range of monthly income and the vertical would show the range of advertising costs. Data points in the chart would be plotted by looking at adjacent cells in column A and column B. The resulting pattern of points can be used to visualize the amount of correlation between the variables.
Özel İçerikler Burada: Diğer Yazıları Kaçırmayın
